
Science On a Sphere®
Science On a Sphere®
View our universe as never before on our dynamic spherical projection system featuring over 360 datasets.
Event Access:
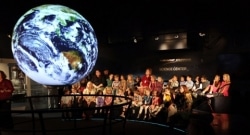 Science On a Sphere® (SOS), the centerpiece of the Northrop Grumman Science Center, was developed by the National Oceanic and Atmospheric Administration (NOAA). The world’s first dynamic spherical projection system, SOS uses special software, satellite imagery and four projectors to render images onto the global surface that provide dramatic, full-motion views of the Earth, Sun, moons and planets in space.
The more than 360 datasets available for classes and public viewing range from simple – but lyrical – image projection to programs featuring images combined with multiple layers of data. The subjects include real images of the Sun, the Moon, Earth, the planets within our solar system and many of their moons. Plus, there are graphic depictions of ocean currents and temperatures, volcanic and tectonic activity, hurricanes and tsunamis, polar ice, air traffic patterns and a wide variety of natural and manmade phenomena.
 SOS provides a dramatic display of our universe and is an ideal educational instrument for teaching science, math and geography, easily translating sometimes complex environmental processes in a way that is simultaneously intuitive and captivating for people of all ages.
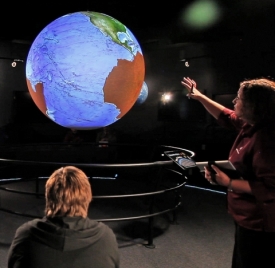
The brainchild of Dr. Alexander (Sandy) McDonald, director of the NOAA Forecast Systems Laboratory in Boulder, Colo., SOS is a six-foot-diameter free-hanging carbon-reinforced plastic ball that uses off-the-shelf high-speed computers, projectors and advanced imaging techniques to create the illusion of the Sun, planets, moons or any other celestial body. The 50 lb. sphere hangs from the ceiling by a three-point stationary suspension system; although it appears the sphere is moving – it is not; the movement affect is created by software and projected images.
Popular Datasets
 Scientists at NOAA and science agencies around the world collect and develop data about the Sun, planets, moons and other celestial bodies and display the results using the Science On a Sphere® system. This data, much of it generated by real-time acquisition systems, exploratory spacecraft, satellites, remote sensing platforms and computer models, can be better understood when it’s converted to images and then shown in a spherical format. There are over 360 datasets available and the number grows every day. The Space Foundation has a large inventory of datasets available for classes and presentations, plus we make the most popular datasets available for our Discovery Center. Below are a few examples (see all datasets here).
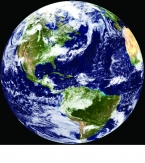
Earth – The Blue Marble
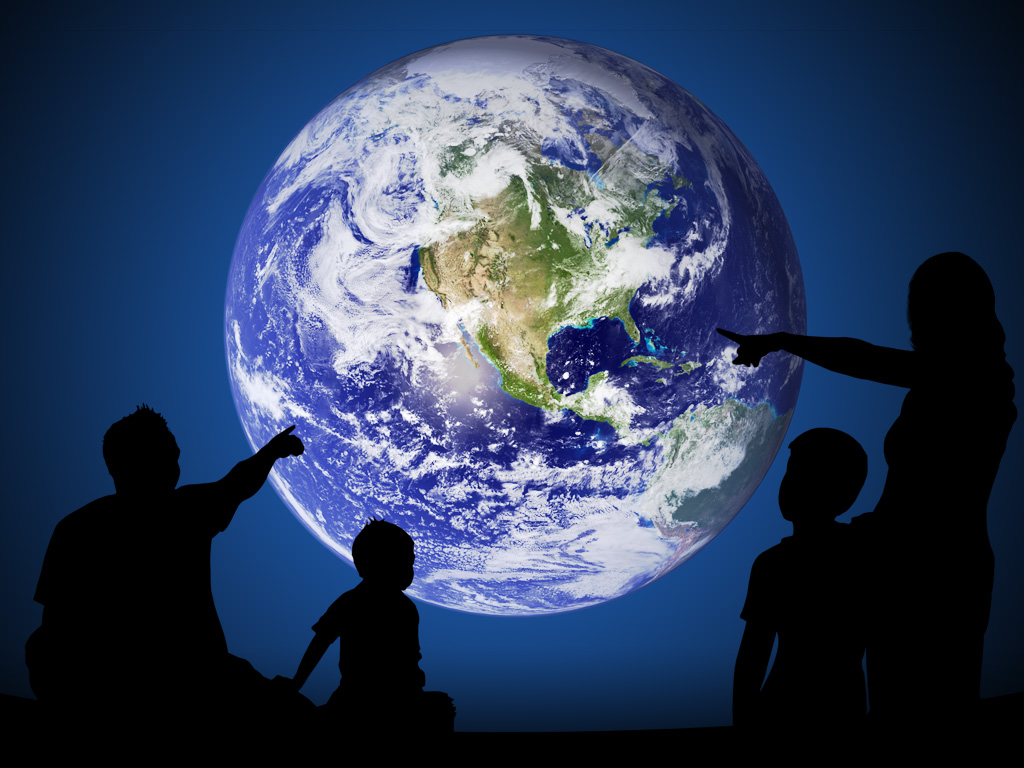
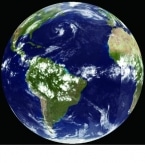 The Blue Marble is an incredibly detailed true-color depiction of the Earth, based primarily on information that came from NASA’s Moderate Resolution Imaging Spectroradiometer (MODIS), which is attached to the Terra and Aqua satellites 435 miles above Earth. Using a year’s worth of images, The Blue Marble is a composite that shows an average view of the Earth. The Blue Marble shows “true color” with the oceans in shades of blue, the clouds white and the lands varying from green forests and grasslands to brown deserts. The shading of the land was done using a dataset compiled by the U.S. Geological Survey’s Earth Resources Observation and Science Data Center. Dataset Name: Blue Marble
Earth’s Moon
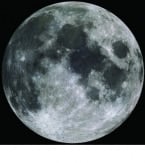 This program shows Earth’s Moon in its entirety, giving perspective on its formation. One theory on the creation of the Moon is that a Mars-sized body crashed into the Earth about 4.5 billion years ago and the material that broke away in the collision formed the Moon. The Moon rotates in such a way that the same side always faces the Earth. The side viewed from Earth is referred to as the near side, while the other side is the far side. Temperatures on the Moon range from -387°F for the side facing away from the Sun to 253°F on the side facing the Sun. Dataset Name: Earth’s Moon
Evolution of the Moon
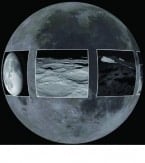 NASA’s Goddard Space Flight Center and the Lunar Reconnaissance Orbiter created this short narrated show depicting the evolution of our Moon – all the way from when it was just a ball of magma orbiting the Earth. See the large impacts that formed the basins of the Moon, watch as lava seeps out and cools to form the dark-colored maria and observe how thousands of crater impacts made the Moon look like it does today. This dataset combines an image of the Moon with inset video segments. Dataset Name: NASA Evolution of the Moon
Real-Time Sun Observations from STEREO
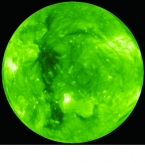 Launched in 2006, the Solar TErrestrial RElations Observatory (STEREO) comprises two satellites on a path similar to Earth’s orbit. One satellite – STEREO Ahead – is in front of and one – STEREO Behind – is behind Earth in orbit. As they drift, they provide a view of the Sun that cannot be seen from Earth. For the first time, the sides – and eventually the back – of the Sun will be visible with the STEREO satellites. This new view of the Sun allows you to observe the structure and evolution of solar storms like never before. In this real-time dataset, imagery from both satellites is morphed together to provide near full coverage of the Sun, filling in the gaps that have not yet been observed. Dataset Name: Sun – STEREO
Mars – The Red Planet
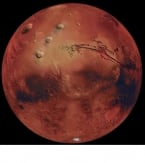 Called the red planet because a high concentration of iron oxides makes its soil red, Mars was once believed to support intelligent creatures; but missions to Mars in 1965 and 1976 revealed that there are no known living organisms there. But, this small rocky planet, fourth from the sun, does have polar ice caps that change in size with the seasons. It is believed that 3.5 billion years ago the most significant floods in our solar system took place on Mars. In 2002, the Mars Odyssey found ice thought to be from the floods about one meter below the surface. Even though this ice would fill Lake Michigan more than two times, it is not enough to explain the erosion visible on Mars. Dataset Name: Red Mars
Jupiter – Biggest Planet in the Solar System
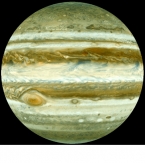
The fifth and largest planet in our solar system and the first of the gas planets, Jupiter’s diameter is more than 11 times larger than Earth and has a radius of 44,423 miles – about one-tenth that of the Sun. What can be seen from space are the ammonia clouds that surround the planet. The visible bands of color are the result of high-velocity winds and storms that flow in opposite directions in adjacent bands. Most notable is the Great Red Spot, a storm that has been observed for 300 years and is so large that it could easily hold three Earths. Jupiter has been described as its own little solar system because of the vast number of moons – 67 – that orbit it, the most of any planet in the solar system. Dataset Name: Jupiter
Real-Time Weather – Using Real-Time Infrared Satellite Data Over Land
 Meteorologists use geostationary infrared (IR) satellite images to determine where clouds are and how they are moving by measuring emitted IR radiation. In comparison to clouds, the Earth’s surface, even on very cold nights, is warm. Clouds absorb the radiation emitted by the Earth and emit their own radiation at much cooler temperatures. Because the height of clouds is inversely proportional to temperature, the tallest clouds are the coldest and, often, bring the most severe weather. Geostationary satellites rotate at the same rate as the Earth, collecting a continuous stream of data for one location so that “movies” of the data can be made. Dataset Name: Linear IR Satellite – Real-Time
Daily Air Traffic
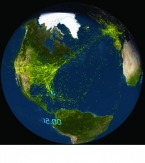 On any given day, more than 87,000 airplanes are in the skies above the United States – roughly 5,000 at any given moment. In one year, controllers handle an average of 64 million takeoffs and landings.* This dataset tracks commercial flights from the approximately 9,000 civil airports worldwide. The day/night terminator is included as a time reference. Flight traffic picks up noticeably during daylight hours and drops off during the night. Each yellow tail is one plane in this visualization. Dataset Name: Air Traffic with Day/Night Terminator
*Source: National Air Traffic Controllers Association
Special thanks to Northrop Grumman for its generosity in funding the Northrop Grumman Science Center, featuring Science On a Sphere®